This article is part of our Collette Calls series.
There was much consternation when Krush was dealt from the homer haven in Milwaukee to the more spacious Coliseum in the East Bay. The move was going to cut into his power, and he may struggle to hit match the 27 homers he hit in 2015. Oops. Davis has hit at least 38 homers in each of his four seasons in Oakland, with that "low" mark coming last season in 117 games. He hit his 39th last Thursday in Minnesota to the opposite field as he is on yet another one of his home run binges in August with 10 homers in the month.
Davis has been a force at the plate every season at the major league level, finishing no worse than seven percent above the league average by wRC+ over his six seasons at the big league level. His strikeout rate is not ideal, but it has not strayed too far from the major league average, which continues to rise on an annual basis. His batting average has also consistently hung just below the league-wide batting average, and consistency is the operative word since his batting average from 2014-2017 was .244 followed by three consecutive seasons of .247.
The power production has been just as consistent with the homers and three consecutive seasons of 100 runs driven in. He is on pace to set career highs in homers, RBIs and slugging percentage this year barring an epic collapse in September. This comes at a time where he has improved his strikeout rate from 30 percent in 2017 to 25 percent in 2018 and is likely ending his run of .240 something batting averages this season. The big question: is the offensive improvement simply him striking out less or is there something more to what he is doing in 2018?
Let's start with his plate discipline indicators. The 15-point improvement in his batting average can easily be loosely coordinated with the five percentage point improvement in his batting average. Still, we need to figure out why he is striking out less. Frankly, the plate discipline indicators do not give us any obvious answers:
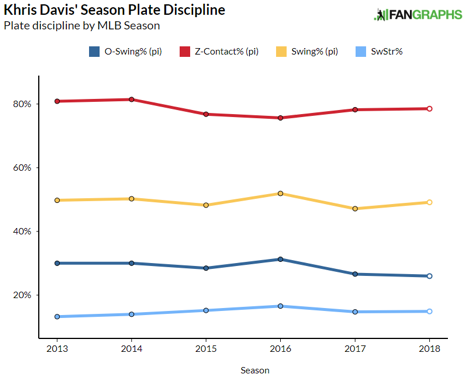
He is swinging more frequently than last year, but not as much as he did in 2016. The other areas have changed no more than one percentage point in either direction. There just is not much here to look at, so we're going to move on.
There are some areas of improvement in some of his splits, none of which are predictive of future success. When any batter is on the pace Davis is for driving in runners, diving into his RISP splits to see what is different within the season. In this area, Davis is also having a career season in a number of areas.
| SEASON | PA | RBI | AVG | BB% | K% | BABIP | HARD% |
| 2013 | 43 | 18 | .250 | 12 | 23 | .217 | 56 |
| 2014 | 144 | 43 | .228 | 6 | 24 | .271 | 39 |
| 2015 | 120 | 38 | .245 | 15 | 31 | .322 | 39 |
| 2016 | 161 | 60 | .243 | 6 | 29 | .277 | 42 |
| 2017 | 165 | 57 | .246 | 9 | 28 | .284 | 35 |
| 2018 | 151 | 64 | .282 | 12 | 29 | .325 | 51 |
He has had a higher frequency of runners on base this year than he has in previous year, and has taken advantage of it. He is still striking out at similar rates, but note the rate of hard contact this year compared to previous full seasons. He is hitting the ball harder, and the harder you hit the ball, the more likely it is to land safely in play. Combine that with the fact that pitchers do worse while pitching with men on base than they do with the bases empty; you can see where some of the statistical improvement is coming from for Davis.
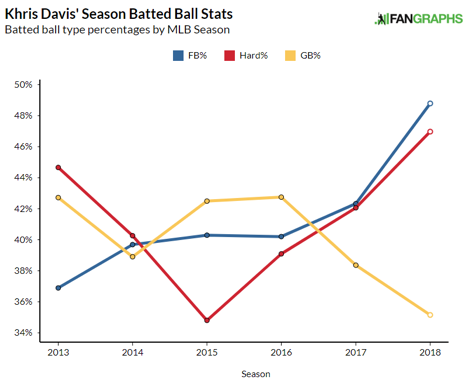
Davis has increased his hard contact rate for a fourth consecutive season, which is no secret if you watch him hit a baseball on a weekly basis. What has flown under the radar if you do not watch him on a regular basis is how he has changed the average flight path of the baseball as he has reduced his groundball rate while working to loft the ball with more regularity.
| YEAR | GB/FB | AVG LAUNCH ANGLE | AVG EXIT VELO | AVG DISTANCE |
| 2016 | 1.1 | 12.9 | 91.7 | 194 |
| 2017 | 0.9 | 14.2 | 92.2 | 202 |
| 2018 | 0.7 | 18.1 | 93.1 | 214 |
Davis's efforts have been the perfect storm of improvement: high it higher, hit it harder, and hit it further. The improvements show up in-season as well if we compare his halves:
| YEAR | GB/FB | AVG LAUNCH ANGLE | AVG EXIT VELO | AVG DISTANCE |
| 1st Half | 0.8 | 17.1 | 93.4 | 206 |
| 2nd Half | 0.6 | 20.4 | 92.3 | 233 |
He is not hitting the ball as hard as he was in the first half, but he is hitting it noticeably further and at a higher angle. That is a factor in turning his .248/.324/.503 first half slash line into the .295/.369/.779 line we have seen in this monstrous second half. The first half is the type of season that we have come to expect of Davis in recent years while his performance since the break leading Oakland into this improbable chase for the AL West title is a near Bondsian offensive output.
Davis has his real-life baseball flaws as he is a terrible defender who is a liability in the field when he has to play it. The good news is he plays in the league with the better rules and can have those liabilities hidden at designated hitter. These conditions are much like the last player who hit 40 homers in three consecutive seasons in Nelson Cruz, who did so from 2014-2016. Even without this big surge since the All-Star break, Davis would have very likely hit 40 home runs by seasons end. Instead, he will very likely have 40 homers before August ends.
This all comes under the shadow of the fact that Davis is a free agent after the end of this season. He makes $10.5 million and there was talk that the A's were trying to work out an extension with Davis as recently as early July. Three consecutive seasons of big homers and run production is going to earn Davis a nice chunk of cash on the open market from some American League team, even with the defensive liabilities. The lessons of the other slugging Davis may loom large this winter for Oakland and a potential suitor, but this skillset leans more closely to Nelson Cruz than it does Chris Davis.
Even the wOBA-xwOBA backs up the awesomeness on display as there is only a four-point different between his .462 second-half wOBA and his .466 xwOBA. Since Davis is "rooted in Oakland," he is truly too legit to quit.
There was much consternation when Krush was dealt from the homer haven in Milwaukee to the more spacious Coliseum in the East Bay. The move was going to cut into his power, and he may struggle to hit match the 27 homers he hit in 2015. Oops. Davis has hit at least 38 homers in each of his four seasons in Oakland, with that "low" mark coming last season in 117 games. He hit his 39th last Thursday in Minnesota to the opposite field as he is on yet another one of his home run binges in August with 10 homers in the month.
Davis has been a force at the plate every season at the major league level, finishing no worse than seven percent above the league average by wRC+ over his six seasons at the big league level. His strikeout rate is not ideal, but it has not strayed too far from the major league average, which continues to rise on an annual basis. His batting average has also consistently hung just below the league-wide batting average, and consistency is the operative word since his batting average from 2014-2017 was .244 followed by three consecutive seasons of .247.
The power production has been just as consistent with the homers and three consecutive seasons of 100 runs driven in. He is on pace to set career highs in homers, RBIs and slugging percentage this year barring an epic collapse in September. This comes at a time where he has improved his strikeout rate from 30 percent in 2017 to 25 percent in 2018 and is likely ending his run of .240 something batting averages this season. The big question: is the offensive improvement simply him striking out less or is there something more to what he is doing in 2018?
Let's start with his plate discipline indicators. The 15-point improvement in his batting average can easily be loosely coordinated with the five percentage point improvement in his batting average. Still, we need to figure out why he is striking out less. Frankly, the plate discipline indicators do not give us any obvious answers:
He is swinging more frequently than last year, but not as much as he did in 2016. The other areas have changed no more than one percentage point in either direction. There just is not much here to look at, so we're going to move on.
There are some areas of improvement in some of his splits, none of which are predictive of future success. When any batter is on the pace Davis is for driving in runners, diving into his RISP splits to see what is different within the season. In this area, Davis is also having a career season in a number of areas.
| SEASON | PA | RBI | AVG | BB% | K% | BABIP | HARD% |
| 2013 | 43 | 18 | .250 | 12 | 23 | .217 | 56 |
| 2014 | 144 | 43 | .228 | 6 | 24 | .271 | 39 |
| 2015 | 120 | 38 | .245 | 15 | 31 | .322 | 39 |
| 2016 | 161 | 60 | .243 | 6 | 29 | .277 | 42 |
| 2017 | 165 | 57 | .246 | 9 | 28 | .284 | 35 |
| 2018 | 151 | 64 | .282 | 12 | 29 | .325 | 51 |
He has had a higher frequency of runners on base this year than he has in previous year, and has taken advantage of it. He is still striking out at similar rates, but note the rate of hard contact this year compared to previous full seasons. He is hitting the ball harder, and the harder you hit the ball, the more likely it is to land safely in play. Combine that with the fact that pitchers do worse while pitching with men on base than they do with the bases empty; you can see where some of the statistical improvement is coming from for Davis.
Davis has increased his hard contact rate for a fourth consecutive season, which is no secret if you watch him hit a baseball on a weekly basis. What has flown under the radar if you do not watch him on a regular basis is how he has changed the average flight path of the baseball as he has reduced his groundball rate while working to loft the ball with more regularity.
| YEAR | GB/FB | AVG LAUNCH ANGLE | AVG EXIT VELO | AVG DISTANCE |
| 2016 | 1.1 | 12.9 | 91.7 | 194 |
| 2017 | 0.9 | 14.2 | 92.2 | 202 |
| 2018 | 0.7 | 18.1 | 93.1 | 214 |
Davis's efforts have been the perfect storm of improvement: high it higher, hit it harder, and hit it further. The improvements show up in-season as well if we compare his halves:
| YEAR | GB/FB | AVG LAUNCH ANGLE | AVG EXIT VELO | AVG DISTANCE |
| 1st Half | 0.8 | 17.1 | 93.4 | 206 |
| 2nd Half | 0.6 | 20.4 | 92.3 | 233 |
He is not hitting the ball as hard as he was in the first half, but he is hitting it noticeably further and at a higher angle. That is a factor in turning his .248/.324/.503 first half slash line into the .295/.369/.779 line we have seen in this monstrous second half. The first half is the type of season that we have come to expect of Davis in recent years while his performance since the break leading Oakland into this improbable chase for the AL West title is a near Bondsian offensive output.
Davis has his real-life baseball flaws as he is a terrible defender who is a liability in the field when he has to play it. The good news is he plays in the league with the better rules and can have those liabilities hidden at designated hitter. These conditions are much like the last player who hit 40 homers in three consecutive seasons in Nelson Cruz, who did so from 2014-2016. Even without this big surge since the All-Star break, Davis would have very likely hit 40 home runs by seasons end. Instead, he will very likely have 40 homers before August ends.
This all comes under the shadow of the fact that Davis is a free agent after the end of this season. He makes $10.5 million and there was talk that the A's were trying to work out an extension with Davis as recently as early July. Three consecutive seasons of big homers and run production is going to earn Davis a nice chunk of cash on the open market from some American League team, even with the defensive liabilities. The lessons of the other slugging Davis may loom large this winter for Oakland and a potential suitor, but this skillset leans more closely to Nelson Cruz than it does Chris Davis.
Even the wOBA-xwOBA backs up the awesomeness on display as there is only a four-point different between his .462 second-half wOBA and his .466 xwOBA. Since Davis is "rooted in Oakland," he is truly too legit to quit.