This article is part of our Weekly Pitcher Rankings series.
With the condensed schedule and the likelihood some teams don't play a complete 60 games, every lineup move takes on more importance. One of my duties is generating weekly pitching and team pitching rankings, which run on Saturdays. Knowing how the sausage is made maximizes the utility of these charts. What follows will be a refresher for some and an explanation for others as the theory and methodology behind the Weekly Pitcher Rankings and Weekly Hitter Rankings is detailed.
Weekly Pitcher Rankings
With so many formats with varied scoring systems, there isn't a one-size-fits-all manner of ranking pitchers. However, while it takes a little work, ranking one's hurlers in points leagues isn't too burdensome. Simply make your best guess how each of your pitchers will perform, convert it to points and deploy the leaders.
The process isn't as straightforward in rotisserie scoring. As such, the weekly pitcher rankings are presented for standard 5x5 rotisserie formats.
The primary thing to keep in mind is the rankings are almost completely formulaic. They involve an innings per start projection, but the rest is driven by a neutral projection, adjusted for park and opponent.
There are advantages and disadvantages to an objective system. The primary benefit is spreadsheets aren't influenced by recency or confirmation bias. Both tend to affect rankings done manually.
On the other hand, spreadsheets are often slow to capture genuine skill changes, in either direction. To that end, the baseline projections for each hurler are adjusted each week. In-season skills stabilize at different rates. The rest-of-season projection regresses the various in-season skills to the initial expectation at appropriate rates. Even with the help of Statcast and other advanced data, some changes aren't recognized, so on occasion a subjective tweak is done, usually massaging the initial expectation to better reflect the new performance level.
The first step is adjusting the park neutral expectation to the venue with the park factors for hits, homers, strikeouts, walks and runs. A small bump is applied for home games while a small dent is factored in for road games.
Next, the quality of opponent is incorporated, based on the handedness of the pitcher. For example, the projected strikeouts for a lefty facing an offense fanning at an above average rate with a lefty on the hill are increased. The caveat is the quality of opponent data, especially against left-handers is unreliable early in the season as it's based mostly off projections, and most fantasy projections don't get that granular for batters. Accordingly, team history is regressed to global split data until the in-season numbers are trustworthy. That said, two months might not be sufficient to have complete faith in team splits, so regression to league mean remains integral to the process.
At this point, a game projection for strikeouts, ERA and WHIP can be determined based on an innings projection. Wins is a bit more complicated.
Even though better relievers are deployed in close games, the team bullpen numbers are used to project the number of runs allowed by relievers after the starter is pulled. These are added to the starter's contribution, essentially predicting a final score for the game when the opposing runs allowed is considered. Win probability is determined based on the score and innings projection.
Everything necessary to rank the projected starting pitchers is now available. The numbers for those expected to take the hill twice are combined and the results are scored pseudo-rotisserie style.
Wins and Strikeouts
The two counting stats are handled the same. The catch is, instead of just scoring each straight rotisserie style, the projections for each pitcher are summed and points are awarded based on the percentage of each hurler's contribution to the aggregate.
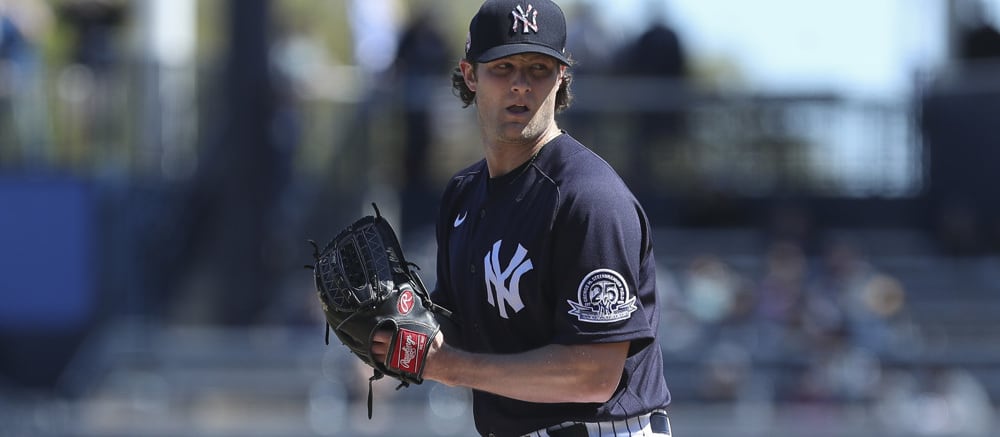
For example, using standard rotisserie scoring with 150 projected starting pitchers, the arm expected to amass the most whiffs would be designated with 150 points. But what if this is Gerrit Cole, with a two-step against lineups prone to punch outs? On a relative basis, he deserves more than 150 points.
Using rotisserie scoring with 150 pitchers, a total or 11,325 points would be allotted. Using this example, each pitcher's proportion of the aggregate wins or strikeouts is multiplied by 11,325 and that's how many points they earn in the category. In the above scenario, Cole would earn more than 150 points.
ERA and WHIP
The ratios are measured by how much the affect a baseline team, projected for league average ERA and WHIP in a 15-team, mixed league using season-ending numbers. To reiterate, there isn't a perfect manner to do this, but a 15-team mixed league is about halfway between shallower mixed leagues and single-league formats, so it's a good approximation. Plus, the size of the league doesn't really influence the rankings, just how far down it's wise to go and still be useful in your format.
The league average team ERA and WHIP is recalculated for each pitcher, using their projected contributions. Obviously, better than average pitchers lower the ratios while poorer than average increase them. The resultant ratios are scored standard roto-style, so according to the same example, the lowest WHIP and ERA would garner 150 points.
Since the same number of cumulative points is distributed within each category, the four totals can be summed, and the pitchers ranked best to worst.
Observations
Personal research on this methodology demonstrates two-start pitchers have the most influence at the extremes. That is, a favorable two-start week really elevates the individual up the rankings while a rough double-dip significantly lowers the placement.
In addition, it was shown over a long season, the added strikeouts and wins gained from prudent streaming outweighed damage to ratios. But while a few disasters could be absorbed, they needed to be balanced by choosing options that took advantage of the favorable matchup(s).
That said, everything is contextual. Those in head-to-head leagues need to manage to their opponent, which may entail taking chances or playing it safe. In standard roto-leagues, the categorical distribution close to the end of the season dictate the direction of the streamers.
Before moving on to hitting, please realize the starters ranked are pulled from the site's Projected Starters page. As you no doubt realize, teams' plans are already in flux; this season, "Subject to Change" is even more applicable. The preliminary rankings are posted Saturday, with the final version updated Sunday night. Even then, something can come up shuffling things before weekly lineup lock. If possible, an emergency update is posted, but it behooves you to keep up on the news and adjust accordingly up to the last minute you're allowed to make moves.
Weekly Hitter Rankings
While the pitching ranking focus on individual, the hitter side is all about teams. A variety of information is available, covering all the rotisserie categories. Everything is presented in index form, with 100 representing the average for the week. The average changes week to week, so the numbers reflect the better and worse teams to target that given week, based on the pitchers each team is projected to face. An index of more than 100 is favorable for batters on that team while one less than 100 is a detriment. Here's a rundown of each consideration and how it can aid lineup decision.
Games by Handedness and Location
The total number of scheduled games is listed along with the number versus left-handed and right-handed starters and the home/away breakdown. The more games the better (thanks, Lord Obvious). The handedness distribution is helpful when deciding on a platoon player. For example, the Dodgers may have seven games, but if they're slated to face four southpaws, Joc Pederson is less enticing than when five or six righties are on the docket. The home/away splits are important since six games in Coors Field may be more appealing than seven on the road.
Home Run Park Factors
This is a weighted average of the week's worth of venues, broken down by handedness. It's helpful to know the aggregate home run park indices if the player in question is expected to provide pop to your lineup.
Stolen Bases
The stolen base ranking combines the ability of the opposing teams' catchers to thrown out runners and how well the foe's projected starters and bullpen control the running game. It's particularly useful to compare a speedster's stolen base index with a bopper's home run factor when choosing which to start.
Quality of Opponent
Perhaps the most overlooked measurement, quality of opponent is a function of the aggregate weighted on base average (wOBA) versus lefty and righty batters. Each team's bullpen is also factored into the ranking. In most cases, facing weaker pitching is more beneficial than playing in a homer-friendly yard, but too many fantasy GMs gravitate toward the park factor.
Runs
Recall from the pitching methodology, a predicted score for each game was generated. The runs each team is projected to score are totaled and ranked. The idea here is players on teams with a higher runs index are more likely to compile RBI and runs in that week.
Averages and Total
When this system was first developed, it was devoid of overall rankings for lefty and righty batters as well as a total team rank. While I might not have deemed it necessary, preferring to use the ranking most apropos to the type of player, there were several requests for overall ranks. Ergo, the addition of combined rankings for left-handed and right-handed batters along with the whole team. Feel free to use at your own discretion.
Pitching matchups
In full disclosure, the table showing the opposing pitchers for each team was first included before the same information was available on the Projected Starters grid. However, since it's handy to be able to see the information while perusing the hitting tables, it's remained part of the weekly post.
There you go friends, a look behind the curtain. As always, transparency is always the goal so please feel free to post any questions in the discussion and I'll do my best to clarify, embellish, etc. Good luck this season — it's already off to a wacky start.


